Chapter 1: Introduction
Published:
Chapter 2: Statistical Learning
What is Statistical Learning
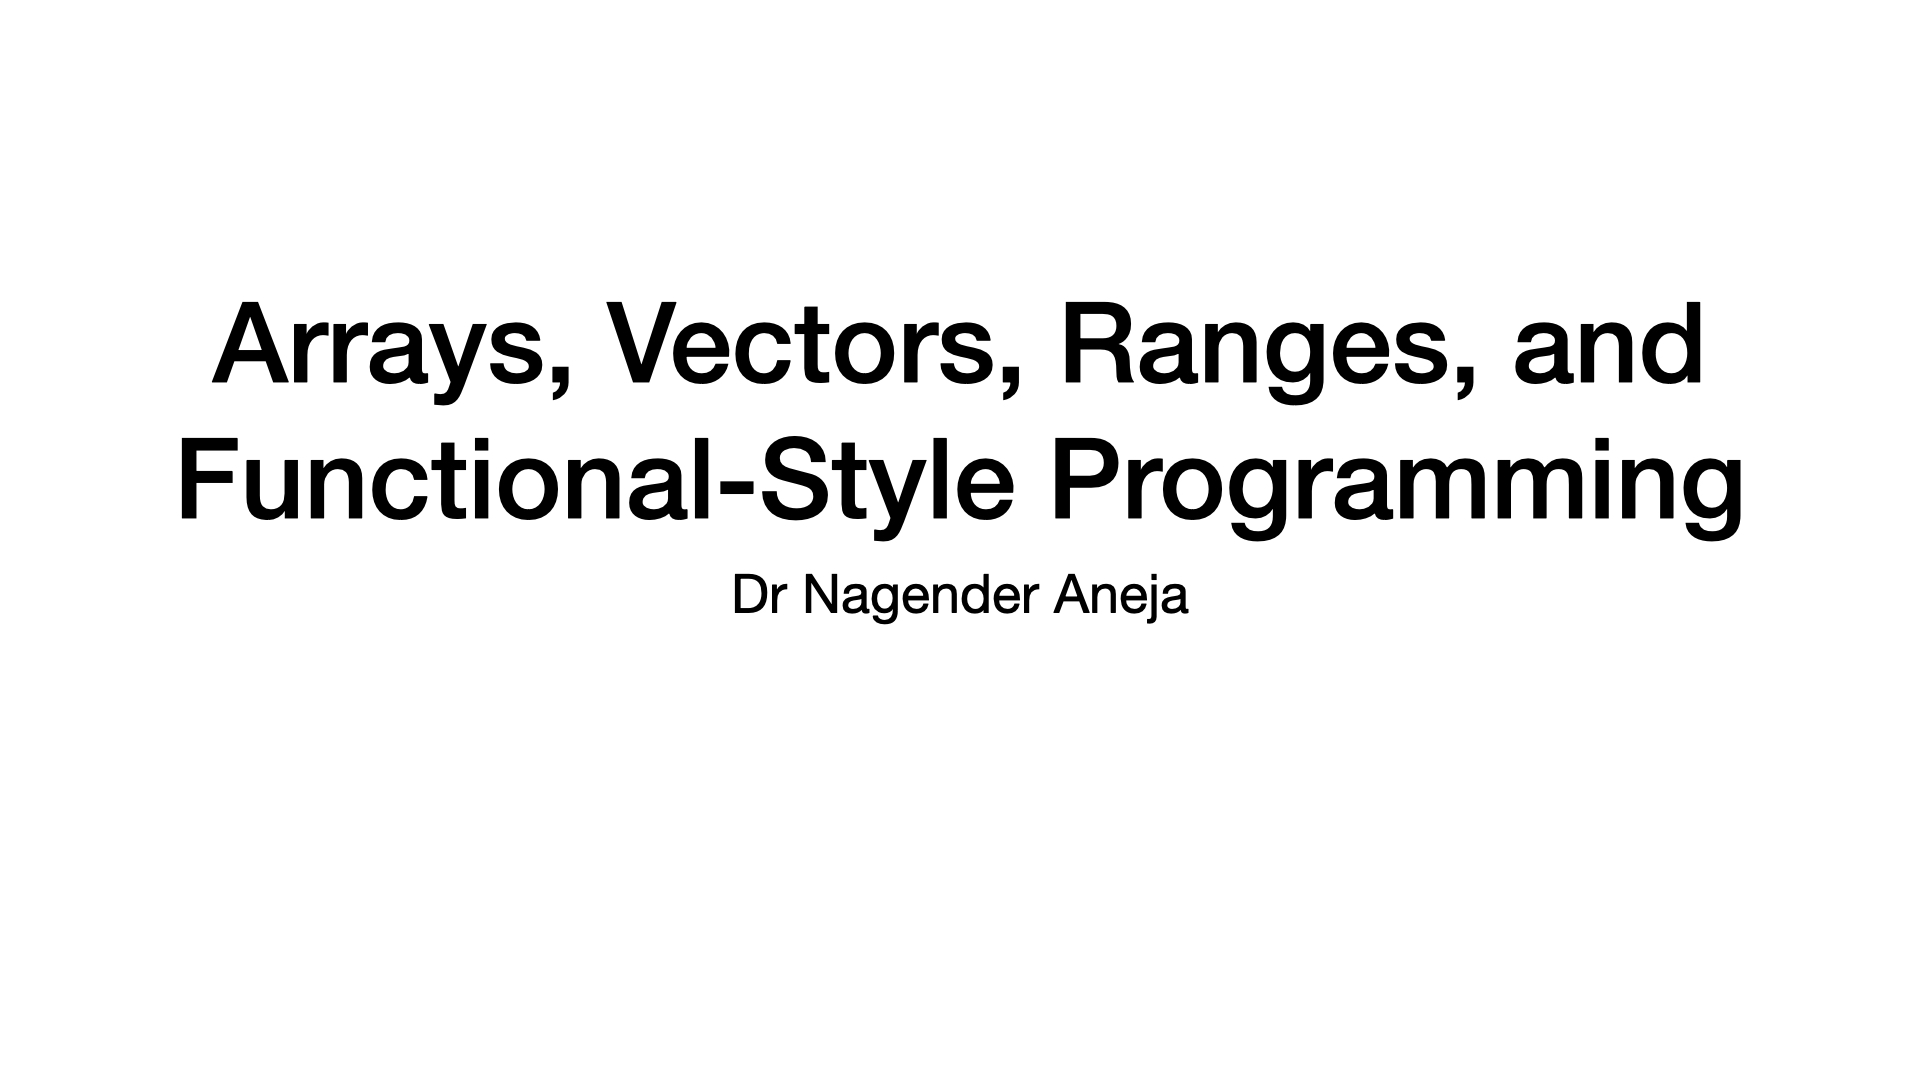
Task: investigate the association between advertising and sales of a particular product
Data: ad budget (in TV, Radio, and Newspaper) and sales for 200 markets
Sales being predicted for TV, Radio, Newspaper Goal: Develop an accurate model that can be used to predict sales on the basis of the three media budgets.
$X$: Predictor, independent variables, features, input variables
- TV, Radio, Newspaper
- $X = (X_1, X_2, …, X_p)$
$Y$: Response, dependent variable
- Sales
Relationship:
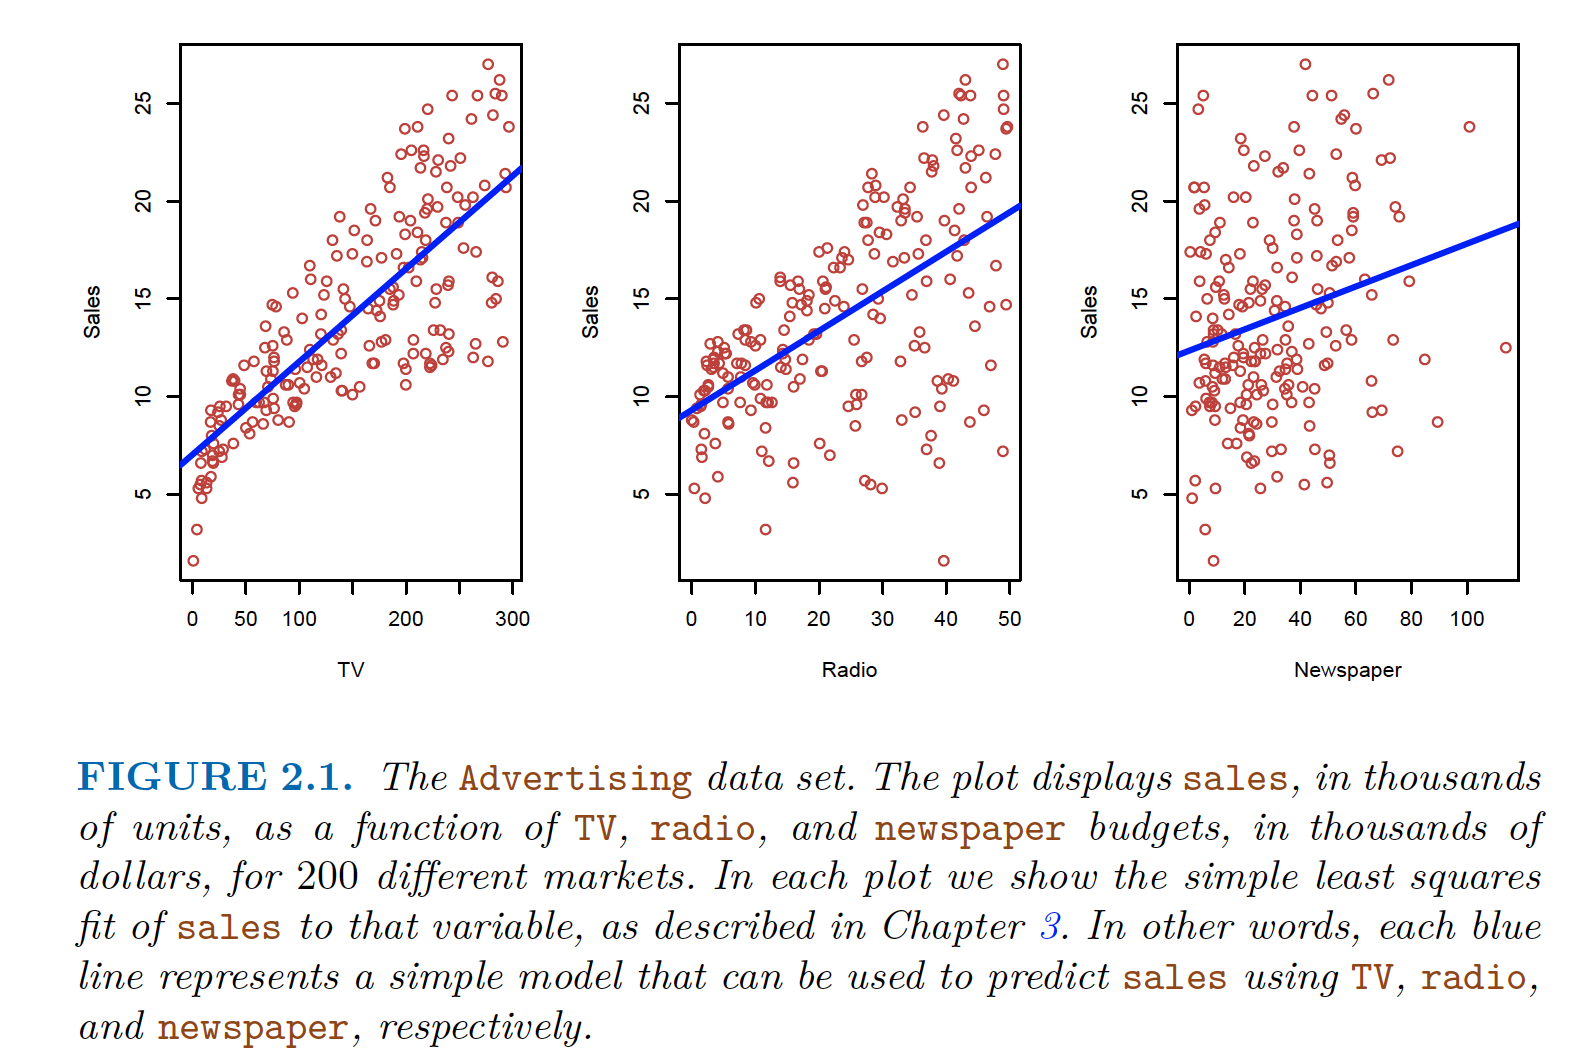
- \[Y = f(X) + \epsilon\]
$f$ is fixed, but an unknown function of $X_1, X_2, …, X_p$
- $\epsilon$ is a random error term independent of $X$ and mean zero
Some errors are +ve and some -ve. Overall errors have approximately a mean zero 
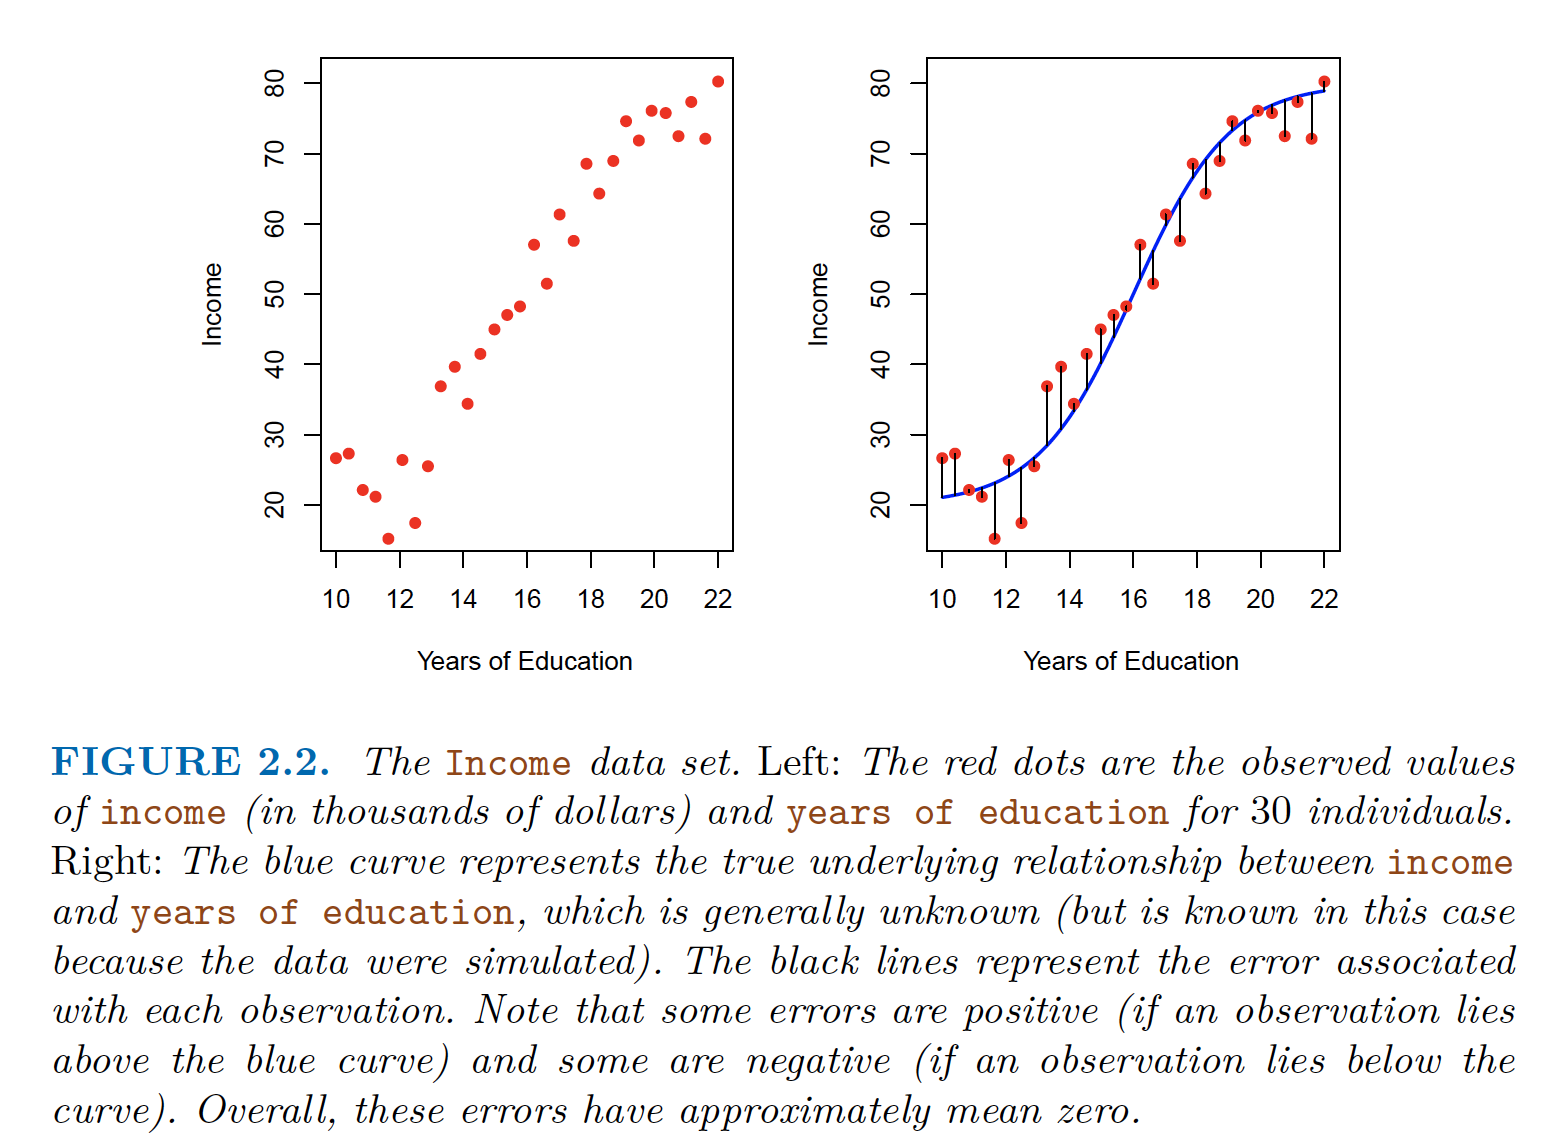
Two Predictors and one response. Some errors are +ve and some -ve. Overall errors have approximately a mean zero In essence, statistical learning refers to a set of approaches for estimating $f$.
Why Estimate $f$
Two Reasons
- Prediction
- Inference
Prediction: $\hat{f}$ is black box
In many cases, $X$ is known and $Y$ is unknown. Since, $\epsilon$ averages to $0$
- \[\hat{Y} = \hat{f}(X)\]
Accuracy of $\hat{Y}$ as a prediction of $Y$ depends on:
reducible error
- since $\hat{f}$ is not a perfect estimate of $f$ but can be made perfect using a different technique
irreducible error
- $Y$ is also a function of $\epsilon$. Further, $\epsilon$ may contain unmeasured variables that are useful in predicting $Y$
- \[E(Y - \hat{Y})^2 &= E[f(X) + \epsilon - \hat{f}(X)]^2 \\ &= [f(X) - \hat{f}(X)]^2 + Var(\epsilon) \\ &= \text{Reducibile} + \text{irreducibile}\]
Inference: $\hat{f}$ is not a black box
- understanding association between $Y$ and $X_1, …, X_p$
- Questions that can be answered:
- Which predictors are associated with the response?
- maybe a subset
- What is the relationship between the response and each predictor?
- maybe positive or opposite
- Can the relationship between Y and each predictor be adequately summarized using a linear equation, or is the relationship more complicated?
- Which predictors are associated with the response?
- Inference on Advertising data:
- Which media are associated with sales?
- Which media generate the biggest boost in sales? or
- How large of an increase in sales is associated with a given increase in TV advertising?
- Real Estate Data
- How much extra will a house with a river view be worth?
- Inference
- Is this house under or over-valued?
- Prediction
- How much extra will a house with a river view be worth?
- Goal: Prediction or Inference or Combination
- Linear model: simple and interpretable inference but less accurate prediction
- Non-linear Approaches: More accurate predictions at the cost of inference and less interpretable model
How do we estimate $f$
Using Training Data
- ${(x_1, y_1), (x_2, y_2), . . . , (x_n, y_n)}$, where $xi = (x_{i1}, x_{i2}, . . . ,x_{ip})^T$
- Find $\hat{f}$ such that $Y \approx \hat{f}(X)$
- The method can be Parametric or Non-parametric
Parametric Methods
Two steps approach
Step 1: make assumptions about the functional form, e.g. shape
e.g. Linear Model: $f$ is linear in $X$
- \[f(X) = \beta_0 + \beta_1X_1 + \beta_2X_2 + · · · + \beta_pX_p \label{eq:lm}\]
- Now, instead of estimating entirely arbitrary p-dimensional function f(X), one only needs to estimate the $p + 1$ coefficients $\beta_0, \beta_1, . . . , \beta_p$.
Step 2: Train the model on the data
- Linear model in Equation $\eqref{eq:lm}$ can be trained by (ordinary) least squares
Problem is to reduced to find a set of parameters => parametric
However, the model may not match the true form of $f$. We can choose flexible model with greater number of parameters. However, this can overfit that means it can fit to noise or errors too closely.
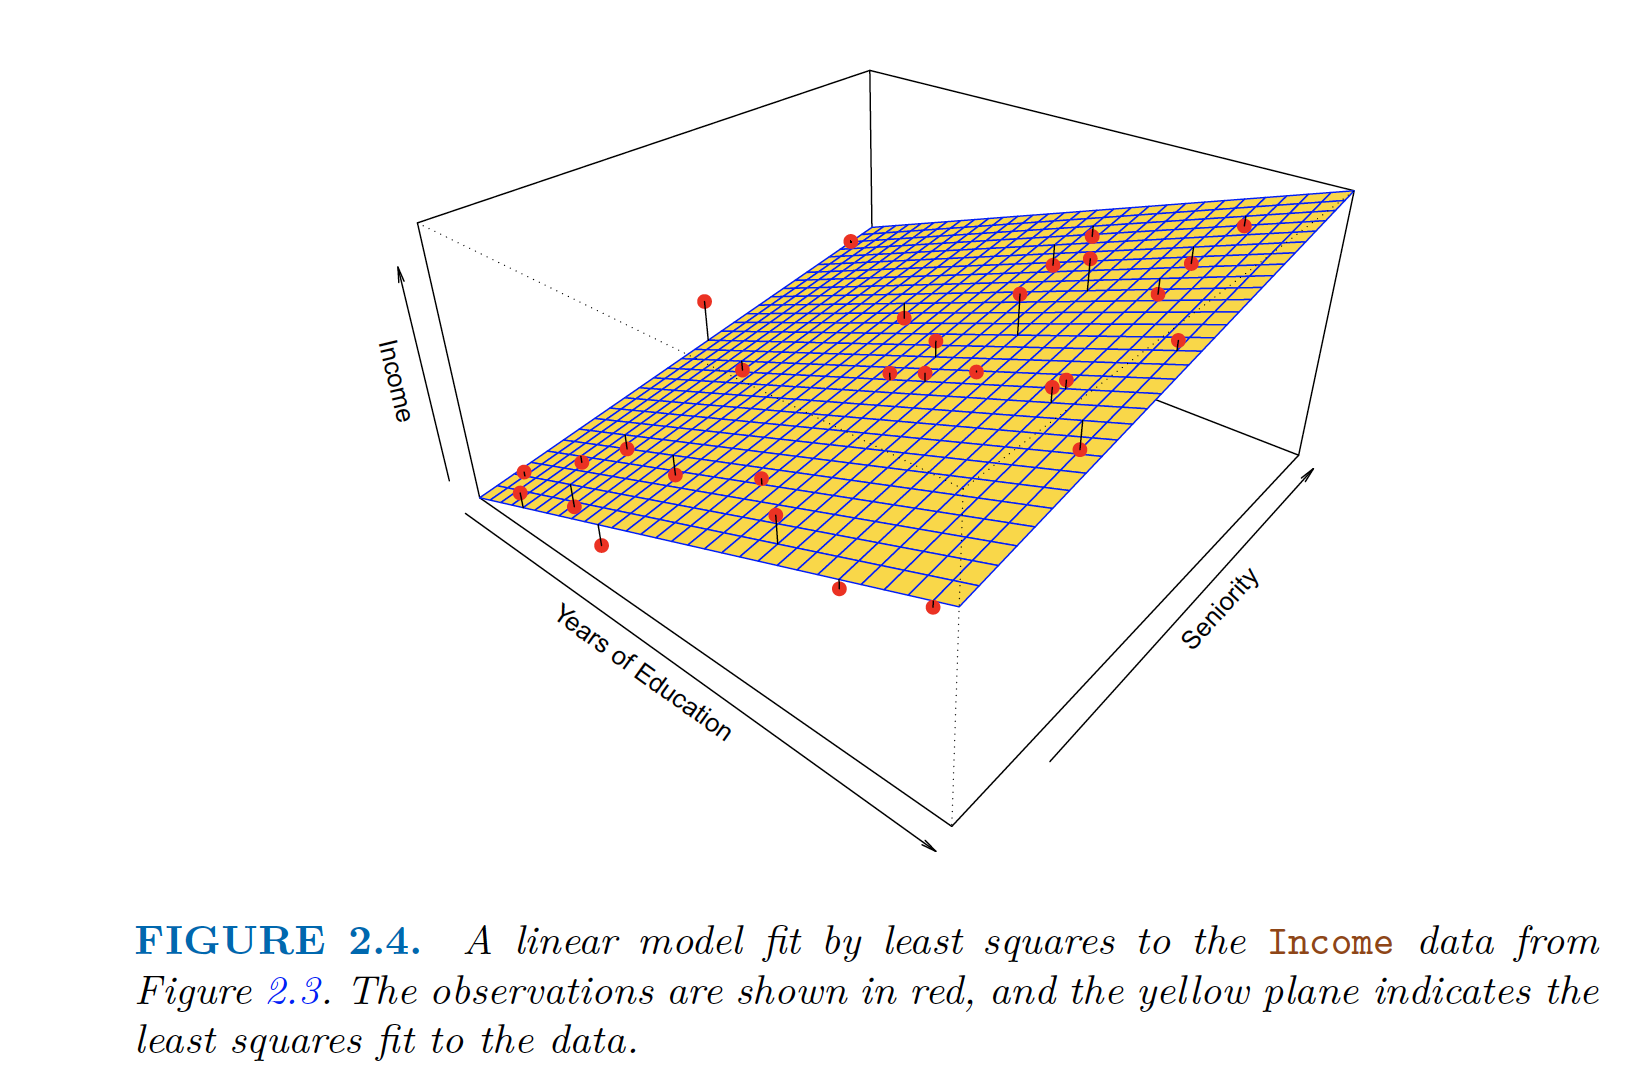
Parametric Approach applied to Income Data $income \approx \beta_0 + \beta_1 \times education + \beta_2 \times seniority$
- True data as in figure 2.3 has some curvature while 2.4 doesn’t capture that. However it still captures the relationship.
Non-parametric Methods
No assumption about $f$
- However, a very large number of observations (far more than is typically needed for a parametric approach) is required in order to obtain an accurate estimate for $f$.
For example, thin-plate spline
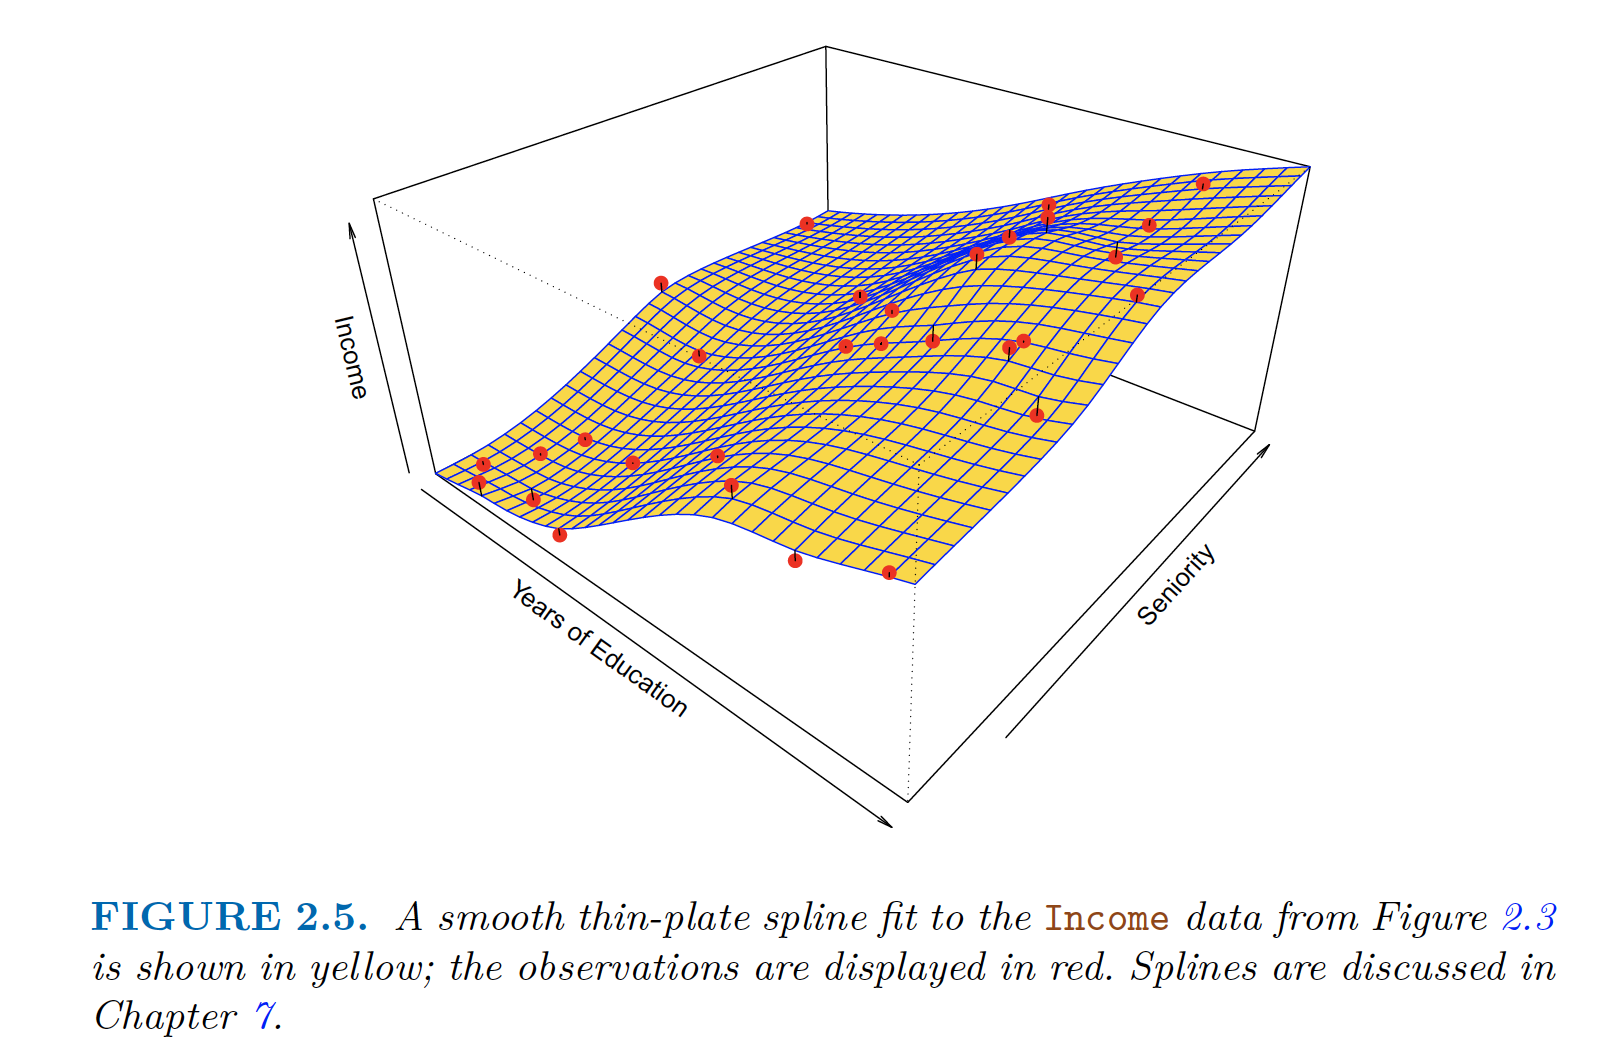
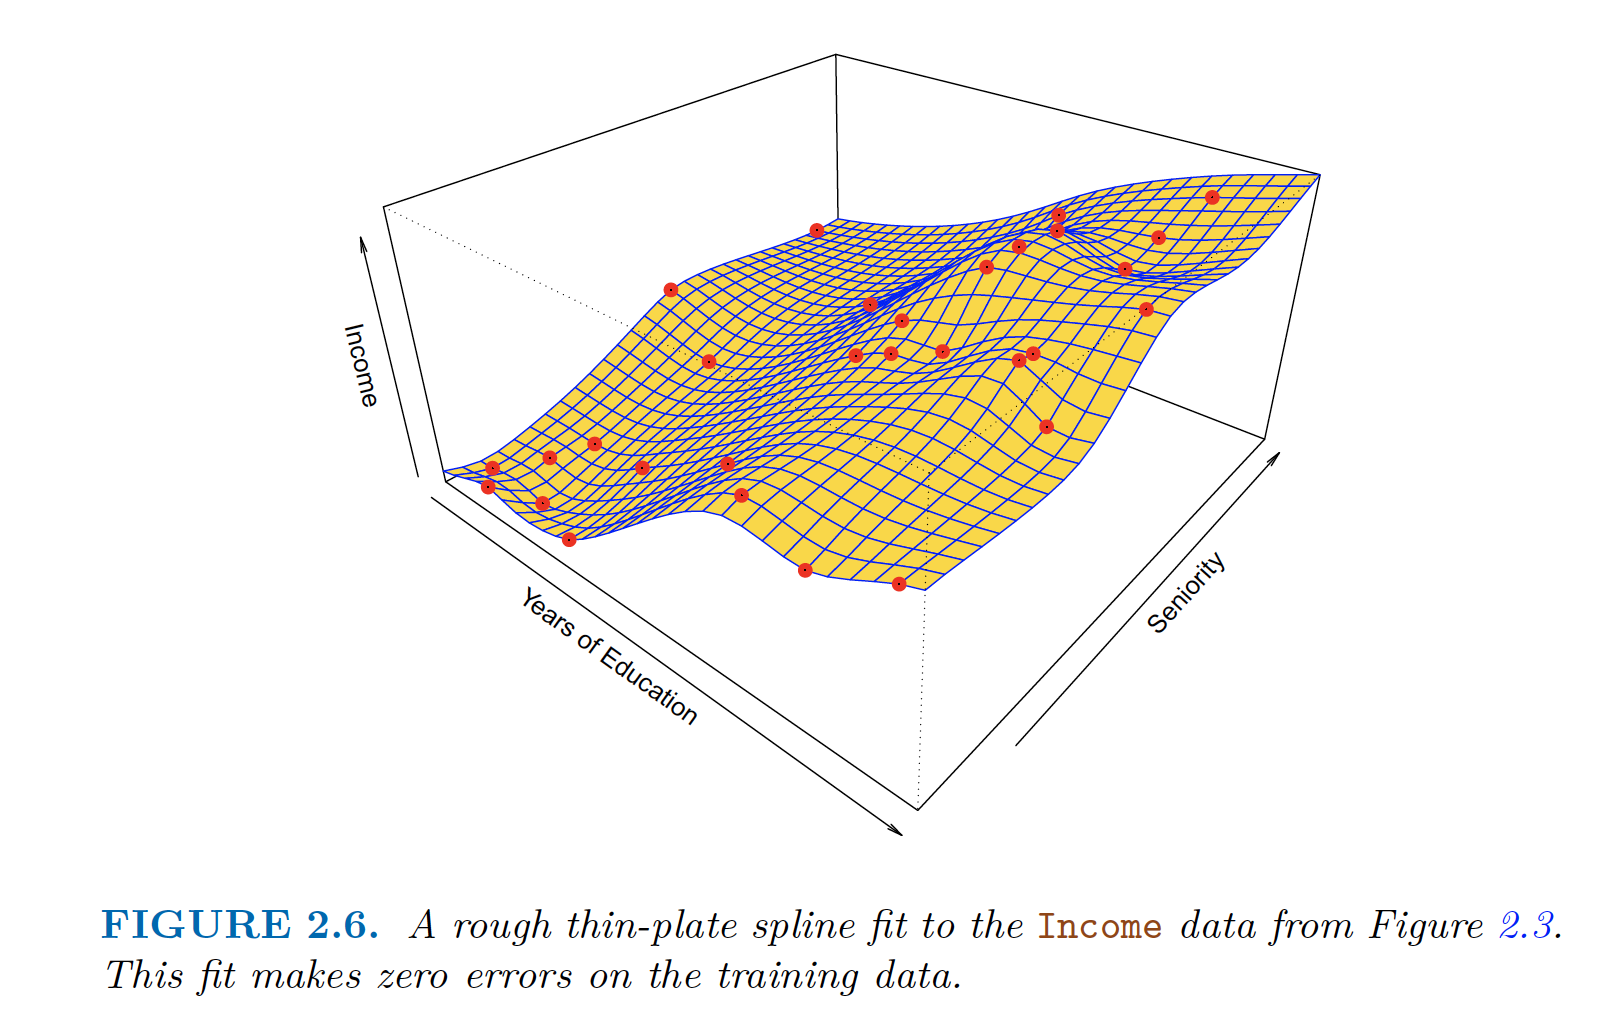
Thin-plate Spline, need to select level of smoothness Thin-plate Spline, with low level of smoothness (zero error) - overfitting
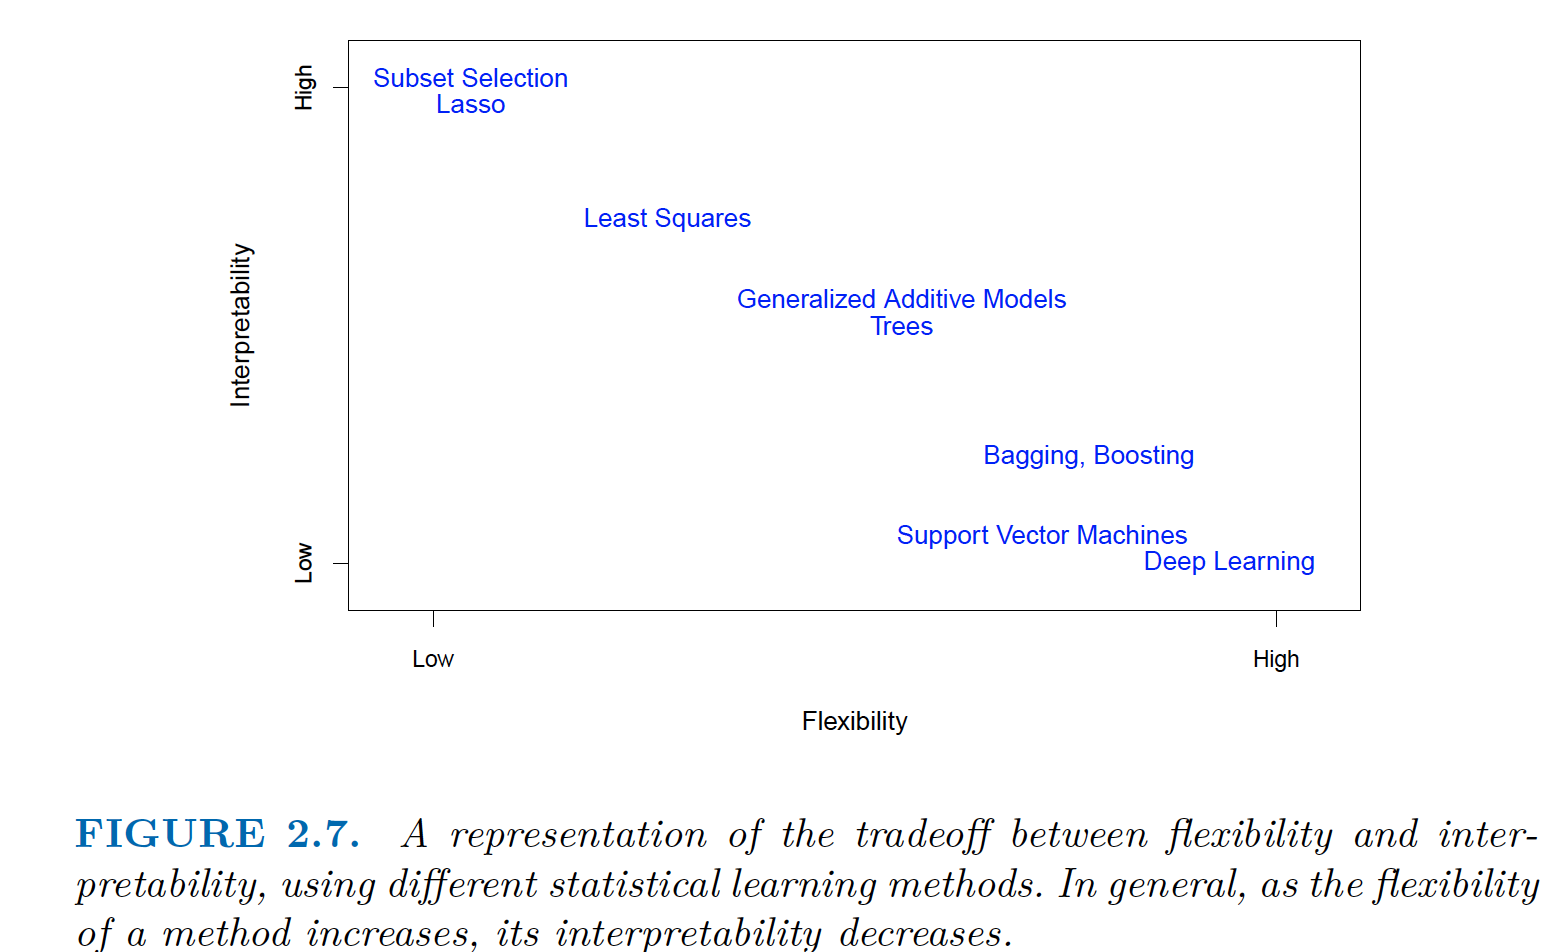
The Trade-Off Between Prediction Accuracy and Model Interpretability
 |
|---|
| Low Flexibility => High Interpretability and High Flexibility => Low Interpretability |
Supervised Versus Unsupervised Learning
Regression Versus Classification Problems
Assessing Model Accuracy
Measuring the Quality of Fit
- Compute for test data
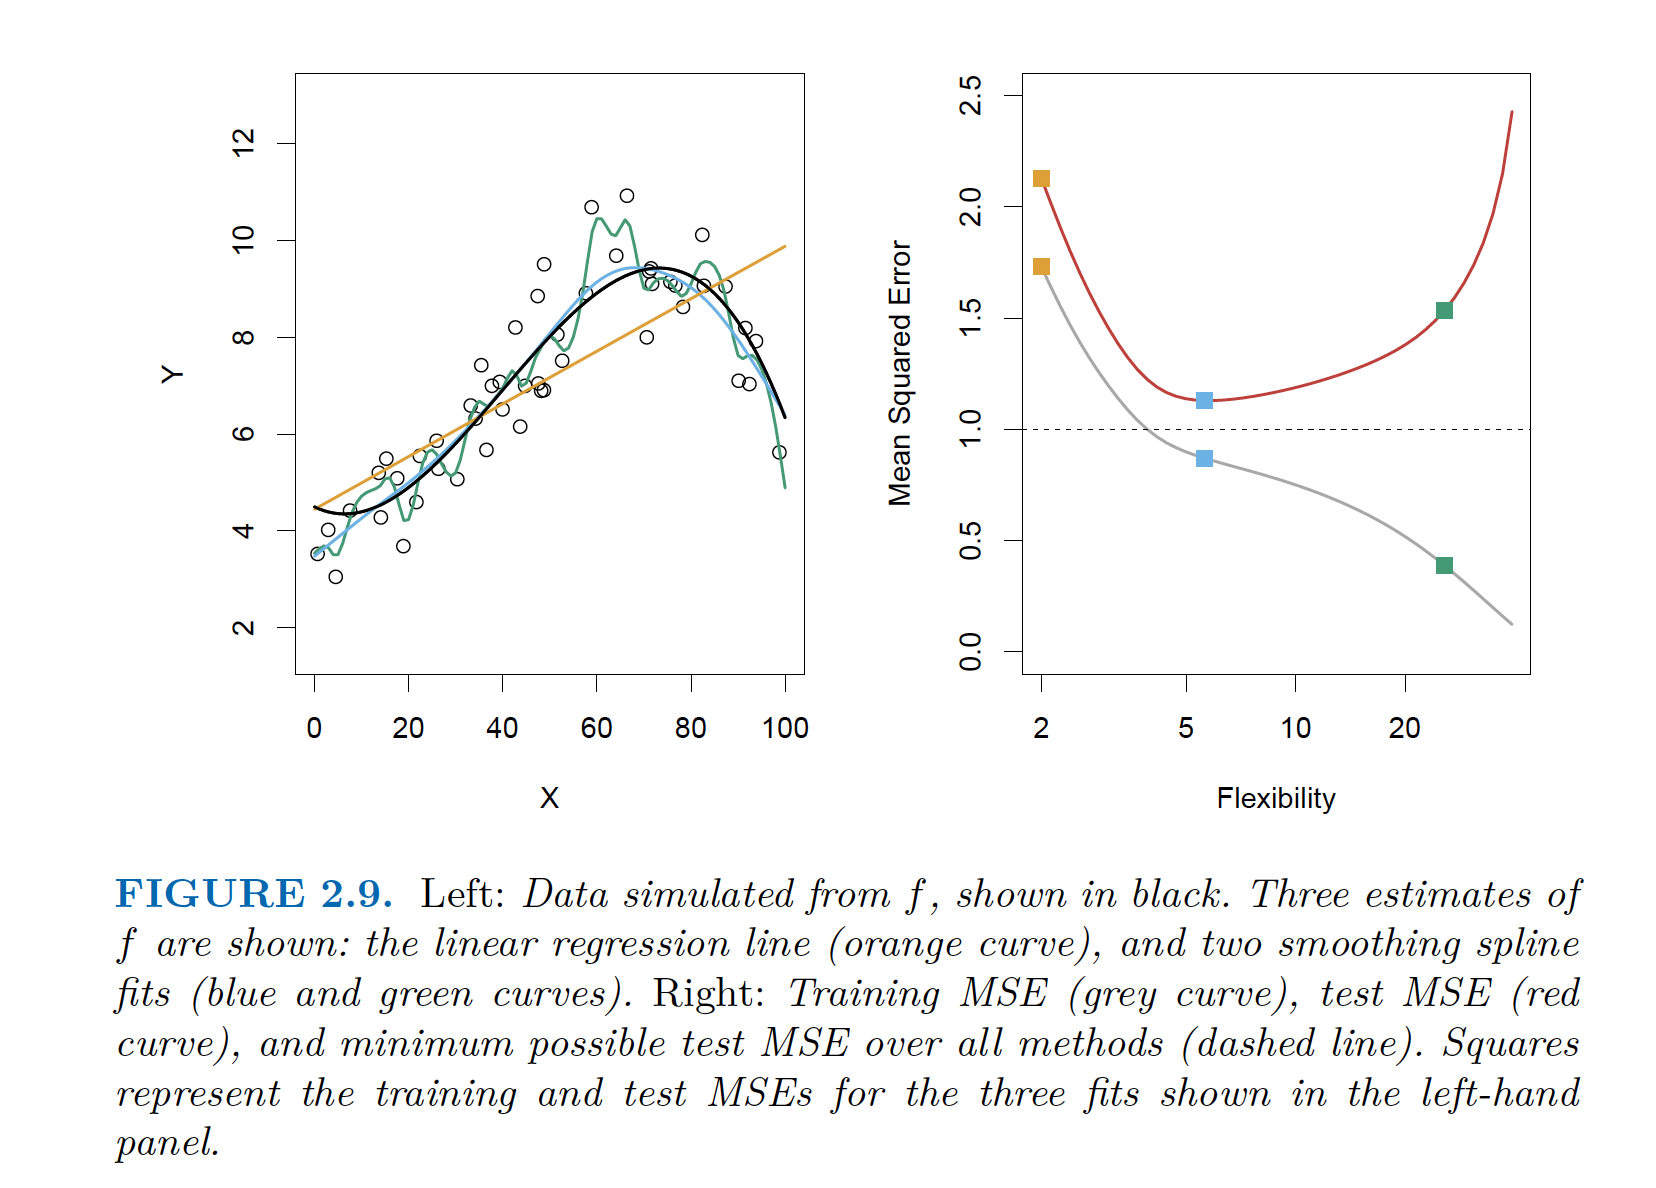 |
|---|
| Left: Actual (Black), Linear Regression (orange), Split fit 1(blue), Split fit 2(green) Right: Train and Test Error for Linear Regression (orange), Split fit 1(blue), Split fit 2(green) |
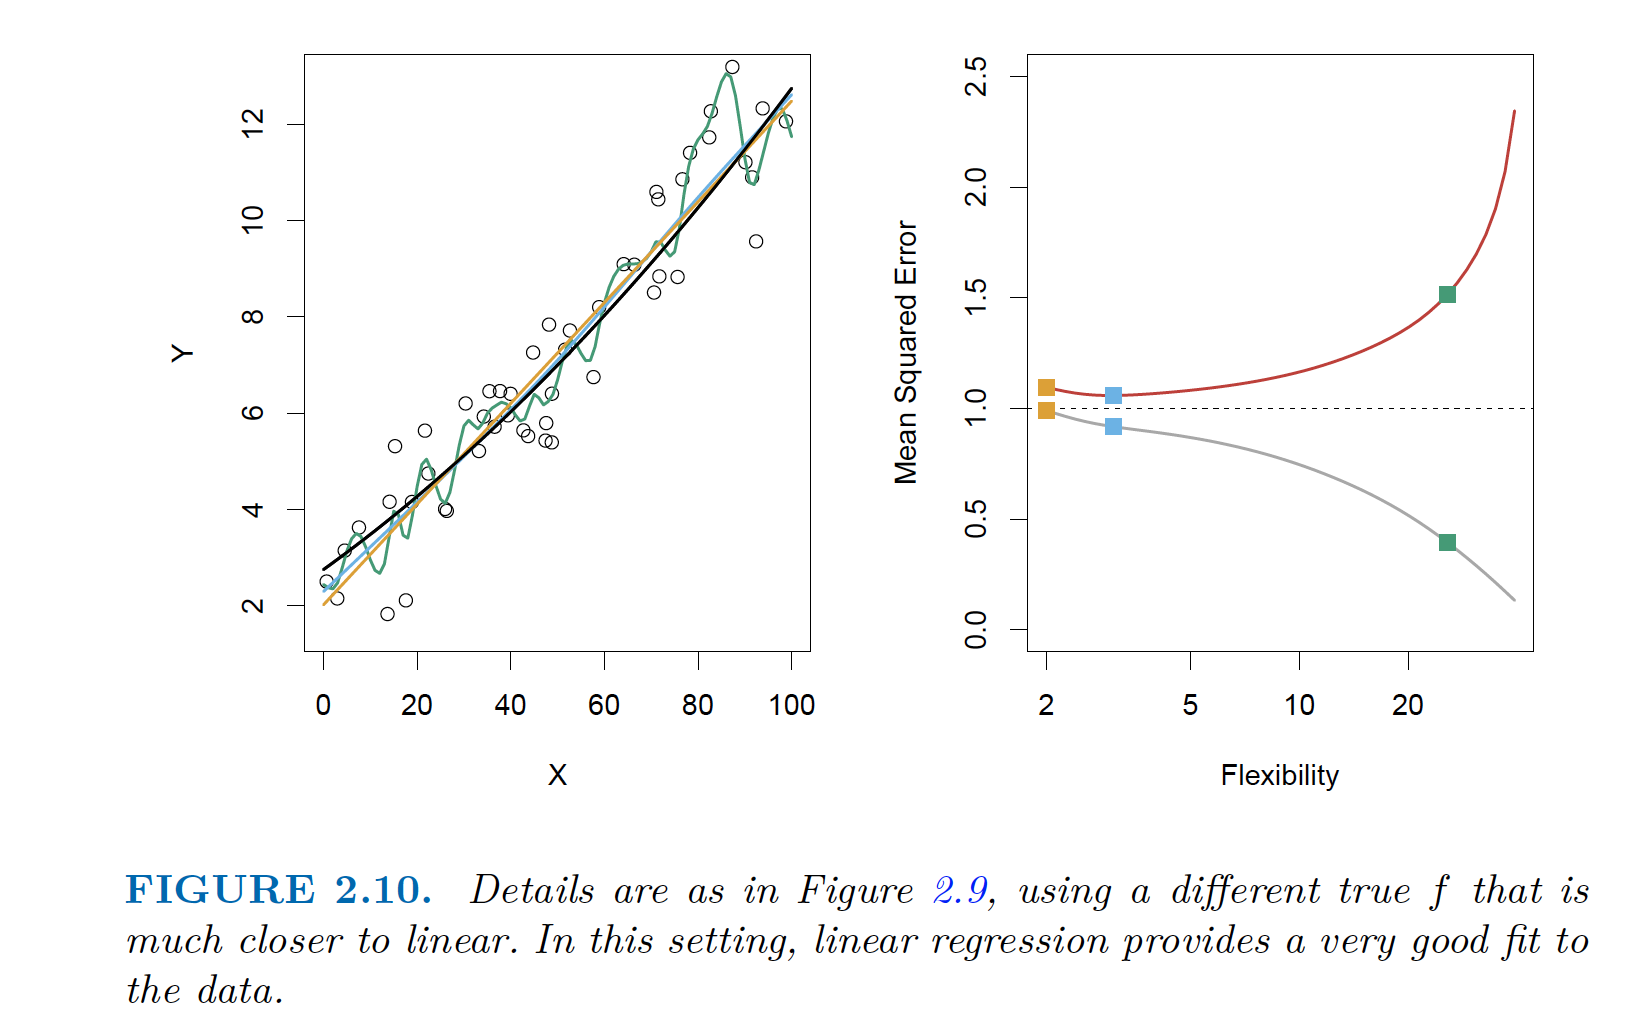 |
|---|
| Another example: Linear Regression has both errors small |
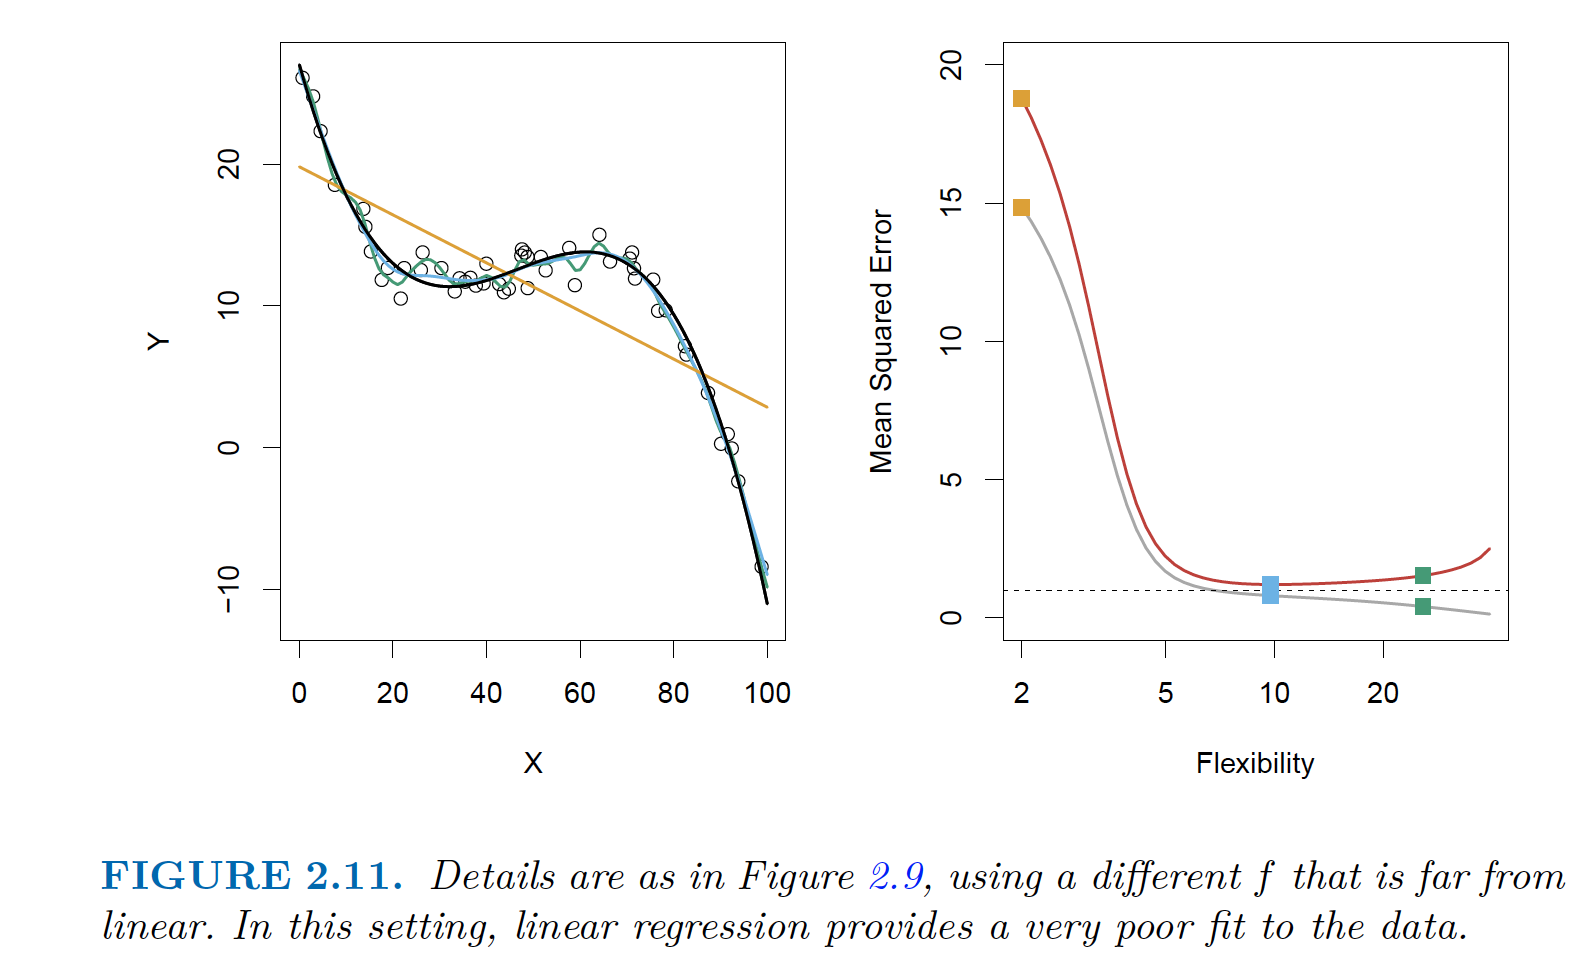 |
|---|
| Linear Regression is poor. Both errors are high. |
The Bias-Variance Trade-Off
\[\text{Expected test MSE at } x_0 = E[y_0 - \hat{f}(x_0)]^2 = Var[\hat{f}(x_0)] + [Bias\hat{f}(x_0)]^2 + Var(\epsilon)\]- To minimize the test MSE, we need to minimize Var and Bias. Variance is non-negative and Squared Bias is also non-negative. Thus minimum expected test is $Var(\epsilon)$, irreducible term.
- Variance
- refers to the amount by which $\hat{f}$ would change if we estimated it using a different training data set.
- Ideally, $\hat{f}{training_data_1} \approx \hat{f}{training_data_2}$
- High Var
- small changes in training data => large changes in $\hat{f}$
- In general, more flexible statistical methods => higher variance.
- Bias
- refers to the error that is introduced by approximating a real-life problem e.g. assumption that there is linear relationship. Irrespective of the amount of training data, there will always be error.
- Trade-off
- Linear Regression can have more bias. Thus, we need more flexible methods to accurately represent the data but that can lead to high variance