Sampling Distributions
Published:
This post covers Sampling Distributions.
Z-Table
Please refer z-Table
Inferential Statistics
- Use sample statistic to estimate population parameter.
- If we obtain a random sample and compute sample statistic, which is a random variable, however, population parameter is fixed
- If the statistic is random variable, can we find its distribution? mean and standard deviation?
Sampling Distribution
sampling distribution of statistic is a probability distribution
Example: Pumpkin Weights

Population
Pumpkin A B C D E F Weight (pounds) 19 14 15 9 10 17 Population Mean = 14
Mean of all Samples of size 2 (without replacement)
%matplotlib inline
import itertools
import numpy as np
import collections
import matplotlib.pyplot as plt

def get_weights(sample):
    sample_weight = []
    for s in sample:
        w = data[s]
        sample_weight.append(w)
    return sample_weight

data = {'A':19, 'B':14, 'C':15, 'D':9, 'E':10, 'F':17}

sample_size = 2

# All possible combinations of sample size two
pumpkins_samples = itertools.combinations(data, sample_size)

samples_mean = []
for sample in pumpkins_samples:
    sample_weight = get_weights(sample)
    sample_mean = np.mean(sample_weight)
    samples_mean.append(sample_mean)

sample_means_2 = sorted(samples_mean)
samples_mean_freq = collections.Counter(sample_means_2)

keys = list(samples_mean_freq.keys())
values = list(samples_mean_freq.values())

values = [v/sum(values) for v in values]

plt.bar(range(len(samples_mean_freq)), values, tick_label=keys)

plt.title('Sampling Distribution', fontsize=14)
plt.xlabel('Sample Mean', fontsize=14)
plt.ylabel('Prob', fontsize=14);
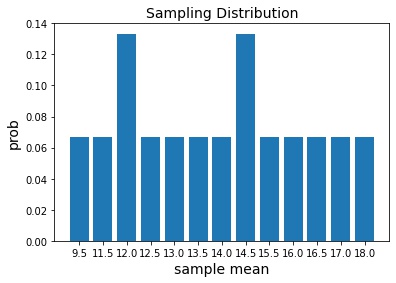
Population Mean is 14 and there is only one case where sample mean equals population mean
Thus, we have error when we use sample mean to estimate population mean
Compute mean of all sample means
print(np.mean(samples_mean)) # 14Even though individual sample mean has error but expected value is right, exactly the population mean.
Overall average of sample mean is exactly the population mean if experiment is repeated
Sample Size = 5
%matplotlib inline
import itertools
import numpy as np
import collections
import matplotlib.pyplot as plt

def get_weights(sample):
    sample_weight = []
    for s in sample:
        w = data[s]
        sample_weight.append(w)
    return sample_weight

data = {'A':19, 'B':14, 'C':15, 'D':9, 'E':10, 'F':17}

sample_size = 5

# All possible combinations of sample size two
pumpkins_samples = itertools.combinations(data, sample_size)

samples_mean = []
for sample in pumpkins_samples:
    sample_weight = get_weights(sample)
    sample_mean = np.mean(sample_weight)
    samples_mean.append(sample_mean)

sample_means_5 = sorted(samples_mean)
samples_mean_freq = collections.Counter(sample_means_5)

keys = list(samples_mean_freq.keys())
values = list(samples_mean_freq.values())

values = [v/sum(values) for v in values]

plt.bar(range(len(samples_mean_freq)), values, tick_label=keys)

plt.title('Sampling Distribution', fontsize=14)
plt.xlabel('Sample Mean', fontsize=14)
plt.ylabel('Prob', fontsize=14);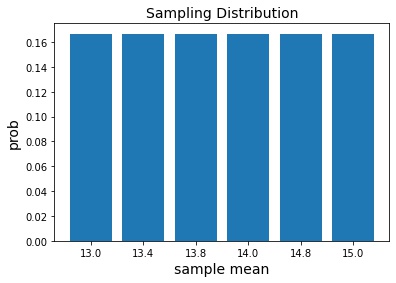
Compute mean of all sample means
print(np.mean(samples_mean)) # 14
Sample Means with size 2 and 5
plt.scatter(x=sample_means_2, y=[2]*len(sample_means_2));
plt.scatter(x=sample_means_5, y=[5]*len(sample_means_5));
plt.axvline(x=14);

plt.ylim(0,6);

plt.title('Sample Means for size 2 and 5', fontsize=14)
plt.xlabel('mean', fontsize=14)
plt.ylabel('sample size', fontsize=14);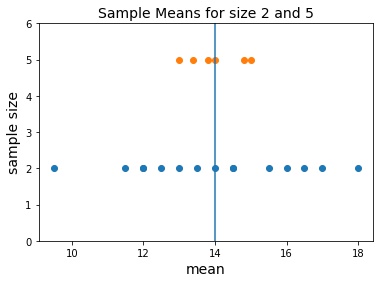
- Sample mean to estimate population mean involves sampling error. However, the error on average is smaller with large sample size (n=5) than with lesser sample size (n=2)
Sampling Error
Error resulting from using a sample characteristic to estimate Population characteristic
Sample means cluster closely to population means when sample size increases
Possible Sampling error decreases as sample size increases
What happens when we don’t have population to sample from?
- Sampling distribution of the sample mean
- Population is normally distributed
- Population is not normally distributed
Population is Normal
Population: $Mean=\mu ~and~ SD=\sigma$
Sampling Distribution of sample mean will also be normal irrespective of sample size
If population is large compared to sample size or sampling is done with replacement
- sampling distribution has mean $ \mu $ and SD $ \frac{\sigma}{\sqrt{n}} $
Standard Error term is used for standard deviation of a statistic
Standard Error (Deviation) $SE(\bar{X}) = SD(\bar{X}) = \frac{\sigma}{\sqrt{n}}$
Sample Mean $ \mu $
Z-Score of Sample Mean $ z = \frac{\bar{x}-\mu}{\frac{\sigma}{\sqrt{n}}} $
Example: Speedboat Engines
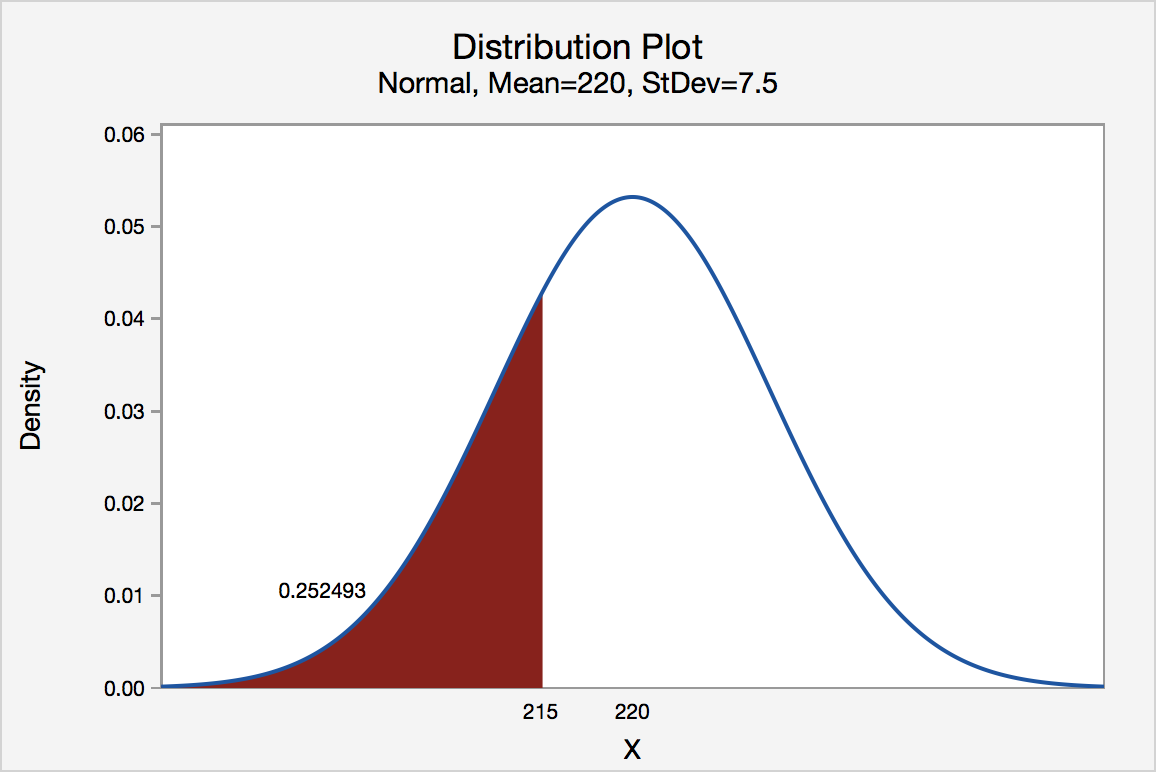
The engines made by Ford for speedboats have an average power of 220 horsepower (HP) and standard deviation of 15 HP. You can assume the distribution of power follows a normal distribution.
Consumer Reports® is testing the engines and will dispute the company’s claim if the sample mean is less than 215 HP. If they take a sample of 4 engines, what is the probability the mean is less than 215?
Find $ P(\bar{X} < 215) $
Since population is normal distribution, implies, $ \bar{X} $ has normal distribution with mean 220 and SD $ \frac{\sigma}{\sqrt{n}} = \frac{15}{\sqrt{4}} = 7.5$
$ P(\bar{X} < 215) = P(Z < \frac{215-220}{7.5}) = P(Z < -0.67) = 0.2514 $
Thus, probability that the mean is less than 215 HP is 25.14%.
https://online.stat.psu.edu/stat500/sites/stat500/files/inline-images/500l4ex4.1.png
If Consumer Reports® samples 100 engines, what is the probability that the sample mean will be less than 215?
$\mu=220 ~ SD=\frac{15}{\sqrt{100}}=1.5$
$ P(\bar{X} < 215) = P(Z < \frac{215-220}{1.5}) = P(Z < -3.33) = 0.00043 $
Probability is 0.043%
Population is not Normal
Central Limit Theorem
- For a large sample size, $ \bar{x} $ is approximately normally distributed, regardless of the distribution of the population one samples from
- If population has mean $ \mu$ and SD $ \sigma $ then $\bar{x}$ has mean $\mu$ and SD $\frac{\sigma}{\sqrt{n}}$
CLT applies to sample mean from any distribution (left skewed or right skewed)
As long as sample size is large, the distribution of sample means will follow approximate Normal Distribution
for questions large means n>30
Central Limit Theorem demonstration
- https://onlinestatbook.com/stat_sim/sampling_dist/
- Begin
- Select Normal
- Click repeatedly Animated or click 5, 10,000 or 100,000 to sample
- See distribution of means getting updated
-
- Sample mean is not normal if population is skewed and sample size is small
- Replication of experiment by 10,000 is good
- If population is normal then sample mean is normal even if n=2
- If population is skewed, distribution of sample mean looks normal when $n$ gets larger
- In all cases:
- Mean of Sample Mean $\equiv$ Population Mean
- Standard Error of sample mean $ \equiv \frac{\sigma}{\sqrt{n}} $
- https://onlinestatbook.com/stat_sim/sampling_dist/
Sampling Distribution of the Sample Mean
Sampling distribution of the sample mean can be defined with help from Central Limit Theorem:
Mean of Sampling Distribution of Sample Mean $\equiv$ Population Mean, $\mu$
Standard Error (Deviation) of Sampling Distribution of Sample Mean, $ \equiv \frac{\sigma}{\sqrt{n}} $
Normal if:
- Population distribution is normal or
- Sample size is large ($ n>30 $)
Example: Weights of Baby Giraffes
The weights of baby giraffes are known to have a mean of 125 pounds and a standard deviation of 15 pounds.
If we obtained a random sample of 40 baby giraffes,
- what is the probability that the sample mean will be between 120 and 130 pounds?
- what is the 75th percentile of the sample means of size n=40?
Solution:
Population not known if normal but n > 40 implies central limit theorem can be applied
Sampling distribution of sample mean will have $ \mu = 125$ and standard error $ \sigma = \frac{15}{\sqrt{40}} = 2.37170825$
$ P(120<\bar{X}<130) = P( \frac{120-125}{2.372} < Z < \frac{130-125}{2.372}) = P(-2.108< Z <2.108)$
$ = P(Z <2.108) - P(Z <-2.108) = 0.9826 - 0.0174 = 0.9652 $
$ 96.52\% $
75th Percentile is $ P(Z<a) = 0.75 \implies a = .6745 $
$ .6745 = \frac{\bar{X}-125}{2.372} \implies 126.6 $
75th percentile of all sample means of size n=40 is 126.6
Sampling Distribution of the Sample Proportion
Notations
- $ p $ is the population proportion. It is a fixed value
- $ n $ is the size of the random sample
- $ \hat{p} $ is the sample proportion. It varies based on the sample
Example: Favorite Color
Name A B C D E Color Green Blue Yellow Purple Blue Proportion who prefer Blue from Population
- $ p = \frac{2}{5} = .4 $
Proportion who prefer Blue based on Sample (Population unknown)
Sample of 2
%matplotlib inline

import itertools
import collections
import random

import matplotlib.pyplot as plt

import numpy as np
import pandas as pd

def get_blues_prop(sample, data):
    n = len(sample)
    blues = 0
    for item in sample:
        color = data[item]
        blues += color == 'Blue'
    return blues/n

def normalize_freq(freqs):
    total = sum(freqs.values())
    for k,v in freqs.items():
        freqs[k] = v/total
    return freqs

data = {'A':'Green', 'B':'Blue', 'C':'Yellow', 'D':'Purple', 'E':'Blue'}

sample_size = 2

samples = itertools.combinations(data, sample_size)

props = sorted([get_blues_prop(sample, data) for sample in samples])

freqs = collections.Counter(props)

freqs = normalize_freq(freqs)

print(freqs)

labels = list(freqs.keys())
height = list(freqs.values())
x = range(len(height))

plt.bar(x=x, height=height, tick_label=labels);
plt.ylabel('Prob', fontsize=16)
plt.xlabel('P (Blue)', fontsize=16);
plt.title('Sampling Distribution of P(Blue)', fontsize=16);
PMF:
P(Blue) 0 0.5 1.0 Probability 0.3 0.6 0.1 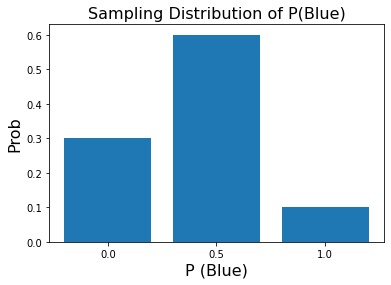
- True Proportion is 2/5 = 0.4
- n=2, doesn’t imply that sampling proportion is equal to true proportion
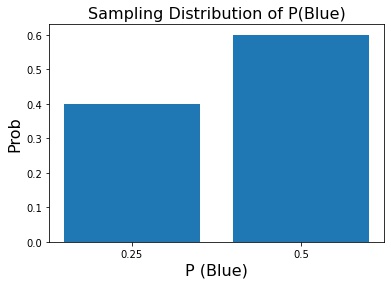
Sample of 4
%matplotlib inline

import itertools
import collections
import random

import matplotlib.pyplot as plt

import numpy as np
import pandas as pd

def get_blues_prop(sample, data):
    n = len(sample)
    blues = 0
    for item in sample:
        color = data[item]
        blues += color == 'Blue'
    return blues/n

def normalize_freq(freqs):
    total = sum(freqs.values())
    for k,v in freqs.items():
        freqs[k] = v/total
    return freqs

data = {'A':'Green', 'B':'Blue', 'C':'Yellow', 'D':'Purple', 'E':'Blue'}

sample_size = 4

samples = itertools.combinations(data, sample_size)

props = sorted([get_blues_prop(sample, data) for sample in samples])

freqs = collections.Counter(props)

freqs = normalize_freq(freqs)

print(freqs)

labels = list(freqs.keys())
height = list(freqs.values())
x = range(len(height))

plt.bar(x=x, height=height, tick_label=labels);
#plt.xticks(ticks=x, labels=labels);
plt.ylabel('Prob', fontsize=16)
plt.xlabel('P (Blue)', fontsize=16);
plt.title('Sampling Distribution of P(Blue)', fontsize=16);
P(Blue) 0.25 0.5 Probability 0.4 0.6
Sampling Distribution of sample proportion will also have sampling error
- Larger the sample size, smaller the spead of distribution