Outliers
Published:
This post covers detecting outliers.
Outliers
https://towardsdatascience.com/5-ways-to-detect-outliers-that-every-data-scientist-should-know-python-code-70a54335a623
https://medium.datadriveninvestor.com/finding-outliers-in-dataset-using-python-efc3fce6ce32
import numpy as np
import seaborn as sns

import matplotlib.pyplot as plt

from scipy import stats
Data
# multiply and add by random numbers to get some real values
data = np.random.randn(50000)  * 20 + 20
data
Method 1 - Scatter Plot
plt.scatter(x=range(len(data)), y=data);
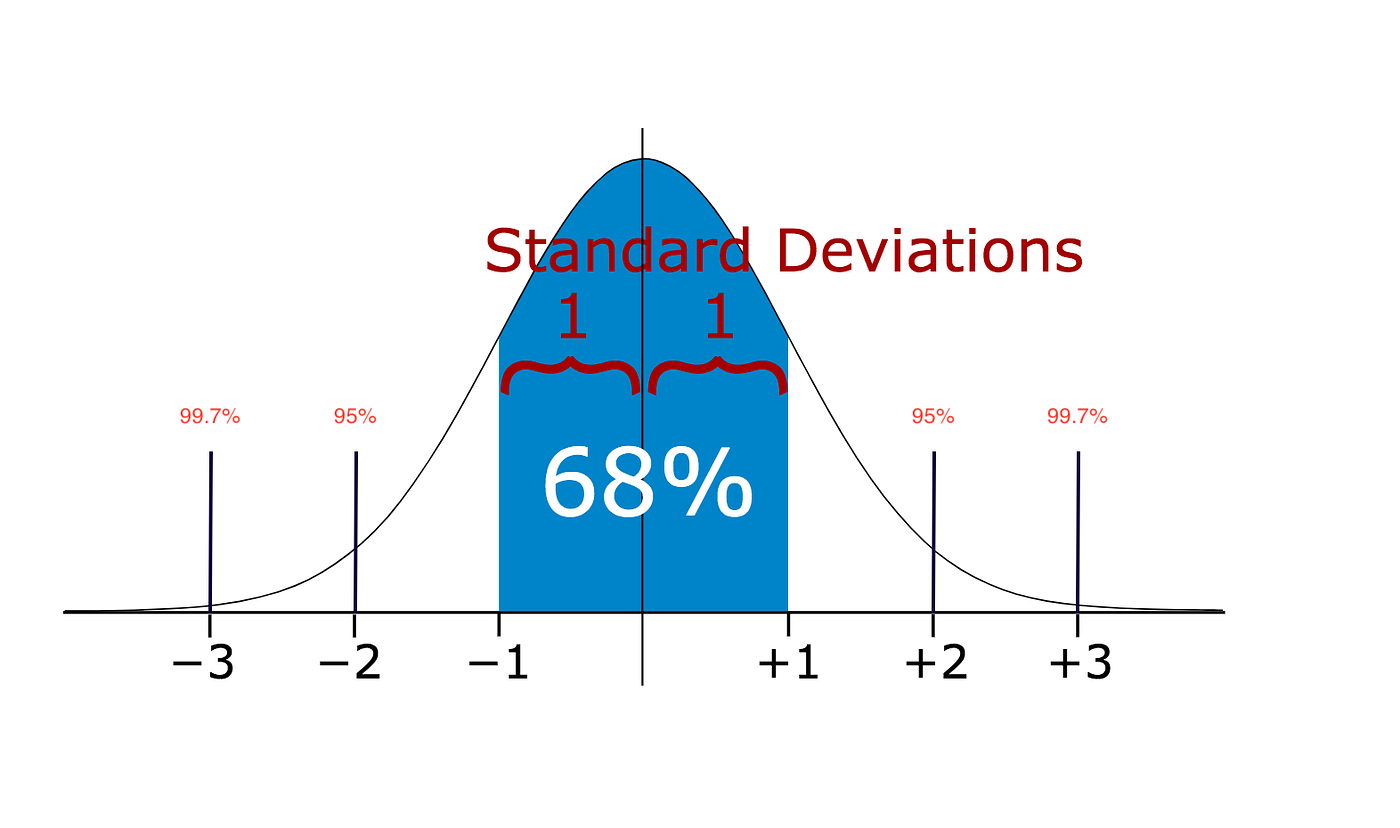
Method 2 — Standard Deviation
If a data distribution is approximately normal then about 68% of the data values lie within one standard deviation of the mean and about 95% are within two standard deviations, and about 99.7% lie within three standard deviations
https://miro.medium.com/max/1400/1*rV7rq7F_uB5gwjzzGJ9VqA.png
def outliers_SD(data):
    #define a list to accumlate anomalies
    anomalies = []

    # Set upper and lower limit to 3 standard deviation
    data_std = np.std(data)
    data_mean = np.mean(data)

    lower_limit  = data_mean - data_std * 3
    upper_limit = data_mean + data_std * 3

    # Generate outliers
    for outlier in data:
        if outlier > upper_limit or outlier < lower_limit:
            anomalies.append(outlier)
    return anomalies

outliers = outliers_SD(data)

plt.scatter(range(len(outliers)), outliers);
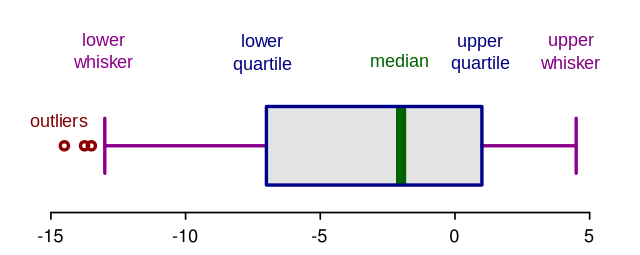
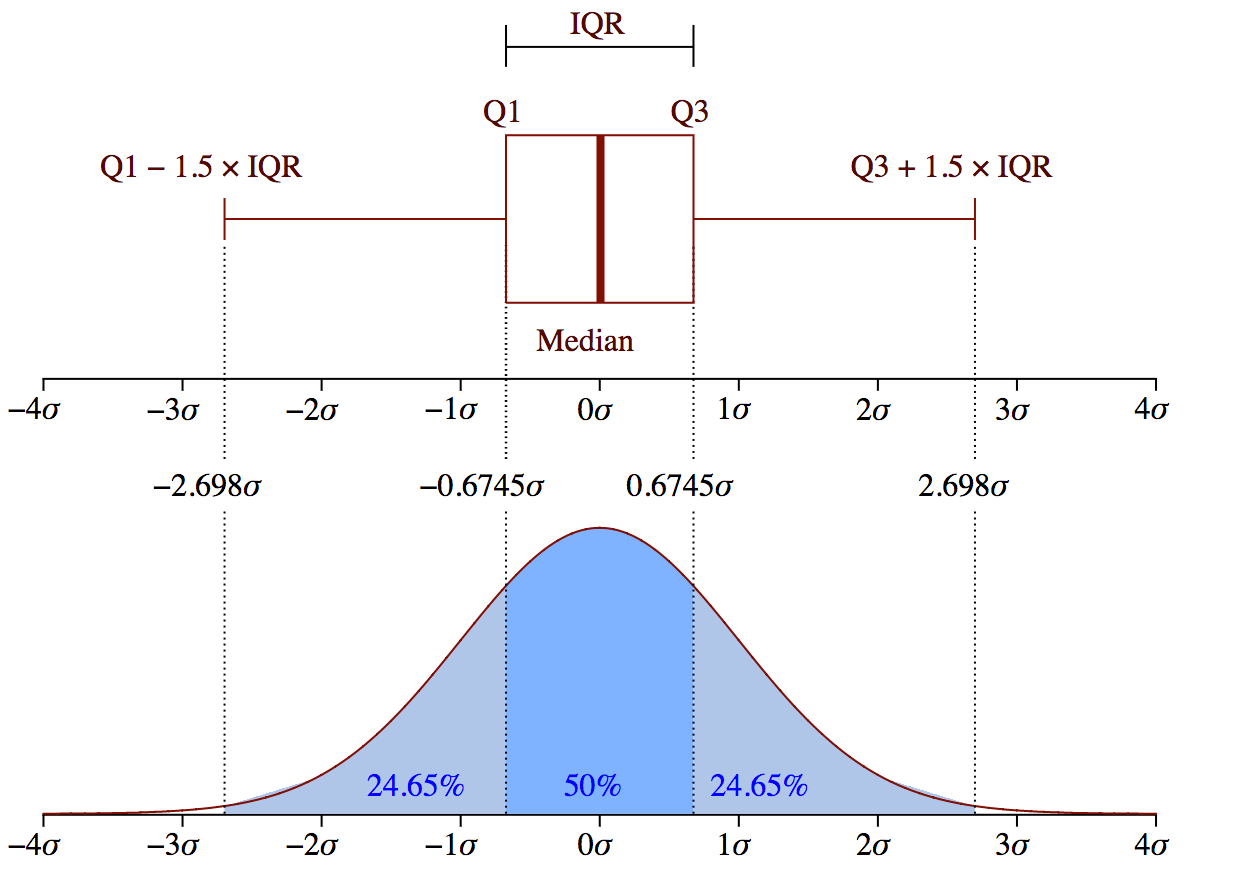
Method 3 — Boxplots
 |
|---|
| https://miro.medium.com/max/1280/1*AU07MCIdvUnjskY1XH9auw.png |
 |
| https://miro.medium.com/max/1400/1*J5Xm0X-phCJJ-DKZMZ_88w.png |
sns.boxplot(data=data);
Method 4 - Using Z score
Z-score is finding the distribution of data where mean is 0 and standard deviation is 1 i.e. normal distribution.
Re-scale and center the data and look for data points which are too far from zero. These data points which are way too far from zero will be treated as the outliers.
In most of the cases a threshold of 3 or -3 is used i.e if the Z-score value is greater than or less than 3 or -3 respectively, that data point will be identified as outliers.
$ Z~score = \frac{(Observation — Mean)}{Standard Deviation} $
$ z = \frac{X - \mu}{\sigma} $
def outliers_zscore(data, threshold=3):
    outliers=[]

    mean = np.mean(data)
    std = np.std(data)

    for x in data:
        z = (x - mean)/std

        if np.abs(z) > threshold:
            outliers.append(x)

    return outliers

outliers = outliers_zscore(data)

plt.scatter(range(len(outliers)), outliers);
def outliers_zscore(data, threshold=3):
    z = stats.zscore(data)
    z = np.abs(z)
    outliers_idx = np.where(z > 3)

    outliers = data[outliers_idx]
    return outliers

outliers = outliers_zscore(data)

plt.scatter(range(len(outliers)), outliers);